
Hey folks,
if you know me, you probably know I am very interested into playing, watching or talking about football (or “soccer”). After decades my home club finaly reached again the seventh German ‘Bezirksliga’ and a German community platform and news publisher “FuPa.net” about amateurs football was looking for suggestions how to split the league. So I decided to make my suggestion and building a Power BI report to help me and also make it visual. Today we will learn about the German football leagues, Power BI, Geocoodinates and how to calculate distances, Power BI Bookmarks, how to use custom functions and make API calls in Power BI and to get some webbrowser content using Power Automate Desktop.
The German football league system
First lets get a short overview about the German football league system. As in other countries too, Football is the most popular sport in Germany and has a huge community. The German Football Association (German: “Deutscher Fußball-Bund or DFB”) has over 6.6 million members organized in over 31,000 football clubs. The clubs are part of a league system, with the “Bundesliga”, “2. Bundesliga” and “3. Liga” on top as the professional leagues. Below the “3. Liga” we have the amateurs leagues. By winning the league at the end of a season, you can get to the next higher league and even get from an amateurs club to a professional club playing in the highest league or even in international competitions.
The order is:
- “Bundesliga”
- “2. Bundesliga”
- “3. Liga”
- “Regionalliga”
- “Oberliga”
- “Landesliga”
- “Bezirksliga”
- “Kreisliga (A, B, C, and D)”
Some associations even have more leagues, because they have many more clubs and need another league somewhere between “Oberliga” and “Bezirksliga”. If you want to learn more, please check out this wikipedia post German football league system.
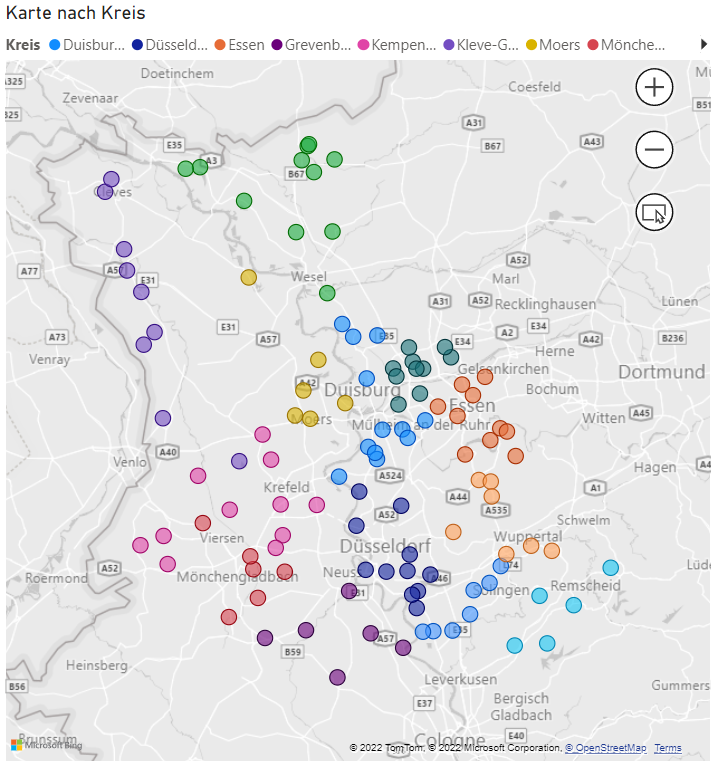
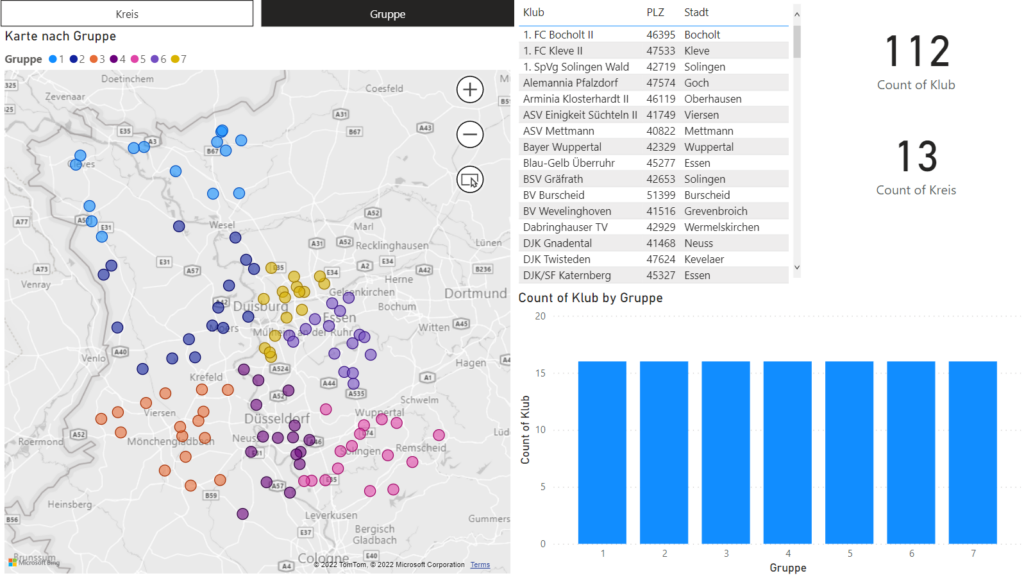
As you can see, there are a lot of clubs, a lot of leagues and a lot of work, if you try to find a good way how to split each league properly, especially within the lower leagues. At the end of this season 2021/2022 when all clubs for next years ‘Bezirksliga’ at “Fußballverband Niederrhein or FVN” (engl: “Lower Rhine Football Association”) were named and qualified, FuPa.net posted a news article asking how to split the Bezirksliga (Article is in German). In total there are 112 clubs all around the the region:

This 112 clubs should to be splitted into 7 groups with 16 clubs each. And of course they are amateurs clubs, so it shouldn’t take hours to get to a game etc. The map you can see above is my overview I had at the end of collecting my data. Let’s dive in:
Collecting the data
First, I needed to get some data that I can analyze and visualize. I wanted to have a map overview within Power BI so that I can select the groups for all clubs by the actual location of the football field and not group them only by their “Kreise” (even within the FVN there are smaller “local associations” called “Kreise”. There are 13 “Kreise” within the FVN). As you can see from the news article, there is already an overview about all the 112 clubs that will play within the distric league next year, but only the clubs name and their “Kreis”, but I also needed the actual address (Street, postal code, City) to visualize them within a Power BI map.
Because the data within the list of FuPa had some other content, I didn’t needed, I just copied the whole content into an empty text file within Visual Studio Code, removed all unnecessary information manually to have a proper list with only the 112 clubs. Because I wanted to have them as a CSV, I used the find and replace function of VS Code to find all “ (“ and replace it with a semicolon “;” and find all “)” and replace it with nothing. I saved it as a CSV file and needed to look how to get the addresses.
Because I couldn’t find a proper API, I used Power Automate Desktop to automate getting some data. First, I only wanted to extract the postal code and city, because I was hoping this is already enough. Within another service www.fussball.de I found a good search results site which gives me the postal code and city of the club:
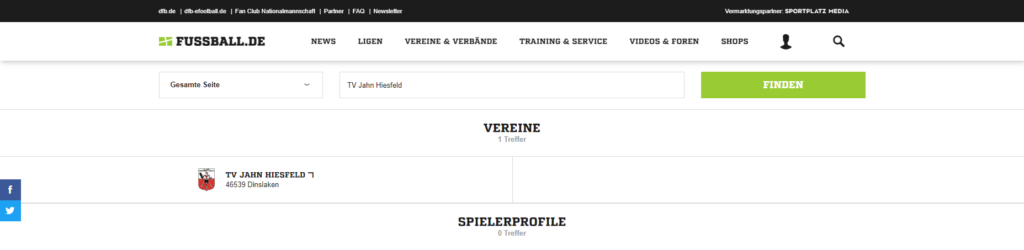
And also the Url was pretty structured: https://www.fussball.de/suche/-/text/TV%20Jahn%20Hiesfeld “TV Jahn Hiesfeld” was one of the clubs name, so I could find all the different clubs and their postal code and city, extract this information and write it back into my CSV. To not go through each club manually, I used Power Automate Desktop:
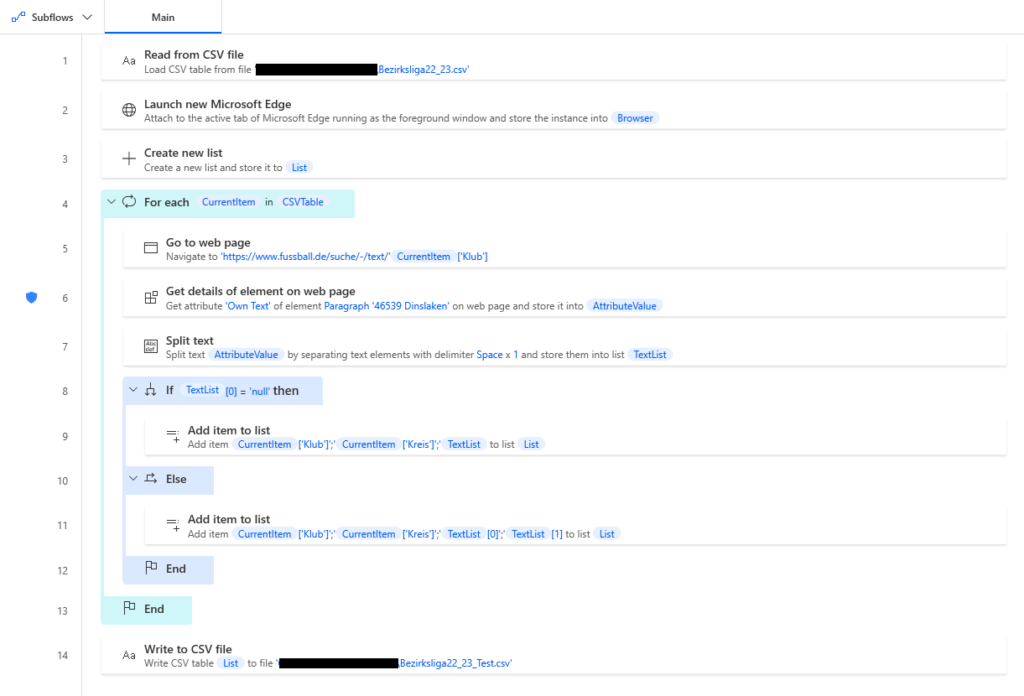
- Read the content from CSV file
- Launch new Microsoft Edge (actually I already had a browser window open, so just use the open browser instance)
- Instead of writing the content directly to the new CSV file, I added the content to a list and after going through each item, I wrote it to an CSV file all at once
- For each item within the CSV file
- Go to the web page at https://www.fussball.de/suche/-/text/%CurrentItem[‘Klub’]%
- Get the details of element on web page (using the “Add UI Element” within the action to get the actual content of the web site paragraph)
- Because sometimes there was an error or the search couldn’t fine the correct club (because the club was spelled different or something else), I also configured the “On Error” on this action so the flow continues to run and the value “AttributeValue” (which stores the value from the site) was set to “null”
- This helps me, when going through the list later, to check for the failed items (only like 10 in total) and add the values manually. Still better than going through 112 clubs :)
- Split text
- The text is in format “12345 Cityname”, but I want to use it as an CSV, so I split the text to add the individual items to the list as semicolon separated
- If there was an error (TextList at position 0 is null) then add the item with only the text (null), else add item %CurrentItem[‘Klub’]%;%CurrentItem[‘Kreis’]%;%TextList[0]%;%TextList[1]%
- Write the list to CSV file
After running through all items and updating the missing items manually, I imported this file to Power BI and used the “Map” visual to show the results. After checking some of the values, I was wondering that some bubbles were not at the actual location where they should be and some are even missing completely. So I checked again some individual items and immediately realized that the information from the site were not correct… Sometimes the clubs didn’t putted in their correct addresses, so I needed to check every item manually using Bing Maps, Google Maps, Fussball.de and FuPa (sometimes even the official clubs homepage) to find out the actual address. In the end I checked up the last home game within fussball.de, because it also gives a address with street, postal code and city. To make the map more accurate (tests showed, that only postal code and city was not accuarate enough to show the actual location, because smaller cities use postal codes for multiple city areas) I also added the street to my CSV file and went through all 112 clubs last home game… I really hope there will be an official API someday for german amateur leagues…
Building my Power BI and grouping clubs
After getting all my data, I imported it into Power BI again, configured the map and saw the results:
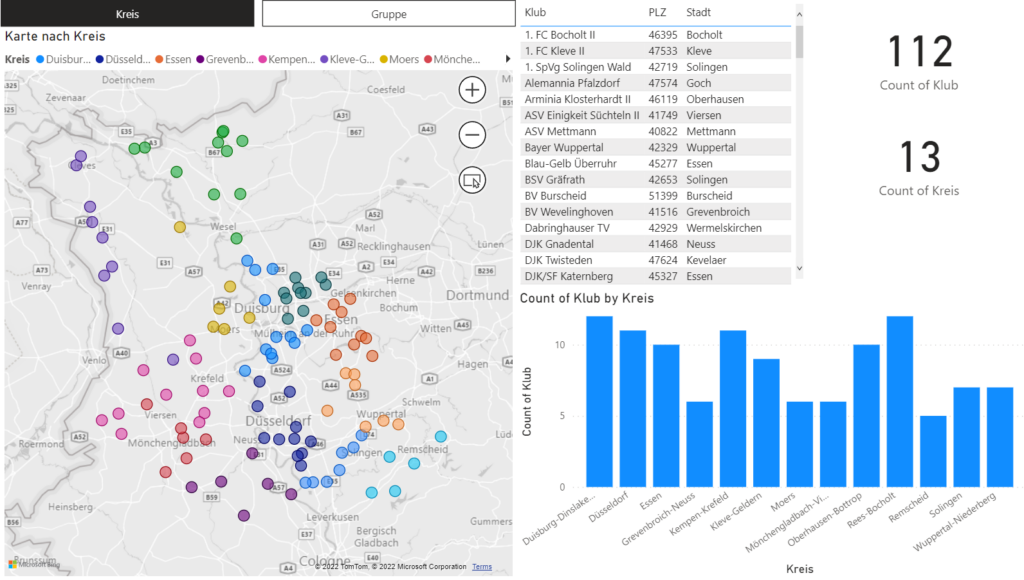
Now I needed to split the teams into different groups. Also this was a manual task, CSV was open in VS Code and the map within Power BI. At the end of the CSV file, I added another column “Group” and started to select some clubs on the map using ctrl + left click and the “Lasso button” within the Map visual. Other visuals like “Table” or “Card” helped me to see how many clubs I have selected. When I got my 16 clubs for a group, I just checked the names within VS Code using the search and added a number into the group column. Afterwards I refreshed the datasource to see the results. Now I changed the map visual to not show me the “Kreis” within the “Legend” but the “Group”, so that I can see which bubble I already selected. After only a couple of minutes I had my first draft of groups. First I thought that was enough, so I started making the report a bit more beautiful by adding some bookmarks and buttons.
I wanted to have a button to switch between “Kreis” and “Group” (german: “Gruppe”) view of the map. I also had a clustered column chart I wanted to change depending on selecting “Kreis” or “Group”. You can do this using Bookmarks in Power BI.
- Open the “Selection” pane from the “View” menu tab. You will see your existing visuals on the site.
- Give your visuals a properly name (like “Map by Kreis”)
- Duplicate the visuals, you want to change by a button
- Change the content and also rename it within the Selection pane (e.g.: “Map by Group”).
When you are done, open the “Bookmarks” pane from the “View” menu tab.
- Click on “Add” twice to add two new bookmarks
- Rename your bookmarks (e.g.: “Kreis” and “Group”)
- Now you need to hide the visuals you don’t need within the “Section” pane
- Before doing something else, hover over the bookmark, so that the three dots are available. Click on them and select “Update”
- Your bookmark is now updated. Repeat step 3 and 4 with the other visuals and bookmark
When you are done, your view should change by clicking on the bookmarks. To add a button into your report, click on “Button – Navigator – Bookmark navigator” within the “Insert” menu tab. You should see a button with the names of your both Bookmarks.
Also check out this post if you need help How to show & Hide visuals using Power BI Bookmarks
Power BI API call and calculating geocoordinate distance
After setting all this things up, I wanted to optimize the groups by checking the distance between the addresses. I found a pretty useful article by Philip Seamark on RADACAD Dynamic distance in Power BI. He use the latitude and longitude of cities to calculate the distance using an algorithm. But I only had the addresses and no latitude or longitude coordinates. After looking around for a while how to easily convert addresses to geocodes, I found this site https://geocode.maps.co, which provides a free API to convert addresses to geocodes and vice versa, the result is a JSON. Thanks very much at this point for this!
To call the service for each of my addresses, I needed to write a custom function in Power Query.
- Within the Power Query Editor add a new source – Web
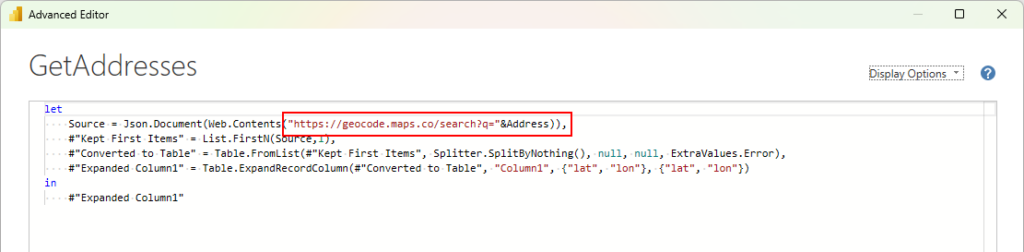
- Add the path to the first address like “https://geocode.maps.co/search?q=42553 Velbert”
- I had some errors when using the actual address including the street, so I just used the postal code and city. It’s not that accurate, but still ok to get a good overview.
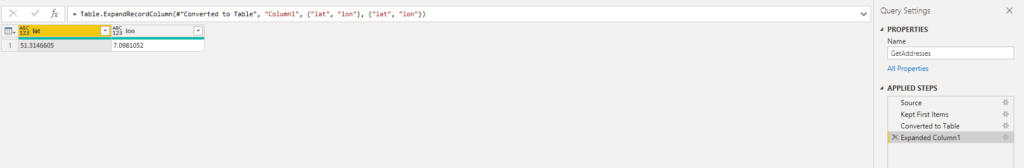
- Power BI should start to apply different steps. I applied the steps “Source” – “Kept First 1 Items” (sometimes the API returns multiple values, but I just need the first) – “Convert to Table” – “Expand Column” (I just need to see the lat and lon values). Your result should look like this:
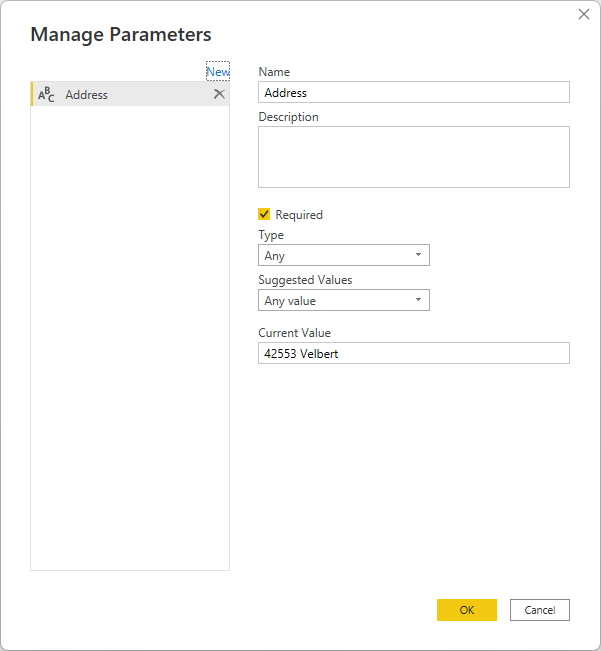
Create a new Parameter name “Address” and edit the created table (from step 2/3) using the “Advanced Editor” by replacing the query with the parameter:
- Your table should still work. Now make a right click on the table within the “Queries” pane and select “Create function”. A dialog box should pop up, give it it a name and click on “OK”.
- Power BI will automatically group the table, the parameter and the function into a new created folder within the “Queries” pane. The created function is now referencing to the created table and return the same results whereever we are using the function, but we don’t need the table within our reports, so you can right click on it and disable “Enable load”.
- Now we need to bring this function into our main table. Our postal code and city is currently separated, so first we need to add a custom column to create a new column (this can later be hidden within the report). Just combine the two columns using &” “& (make sure both columns are formated as text/you can change the data category within the Power BI Desktop, but letting the data type as Text within the Power Query Editor)
- After creating the custom column which includes postal code and city, click on “Invoke Custom Function”, give it a name, select the function from the dropdown and select the new created column as input:
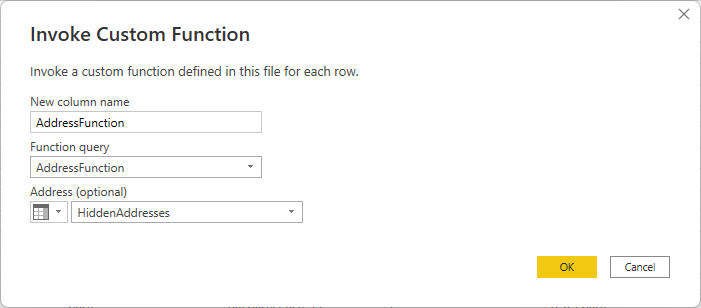
You should see a new column with a table within the record, expand the column into the lat and lon and close and apply the Power Query editor
Now we do have the latitude and longitude values of each item. Following the article of Philip to dynamically calculate the distance, I first needed to create some more tables:
rom City = SUMMARIZECOLUMNS(
    Bezirksliga22_23_Test[Klub],
    Bezirksliga22_23_Test[PLZ],
    Bezirksliga22_23_Test[Stadt],
    Bezirksliga22_23_Test[lat],
    Bezirksliga22_23_Test[lon]
)
Cities = SUMMARIZECOLUMNS(
    'From City'[PLZ]
)
Then create the relationships between the three tables:
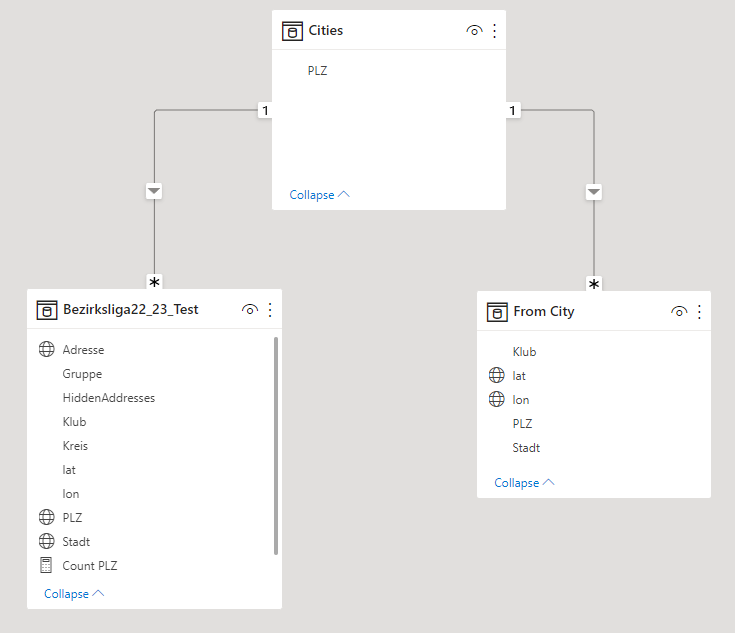
Make sure the Data Category for each latitude and longitude value is set to an appropriate setting and make sure it’s not summarizing the data.
Now create a new measure within the main table (mine is called “Bezirksliga22_23_Test”)
Kilometers =
    var Lat1 = MIN(Bezirksliga22_23_Test[lat])
    var Lon1 = MIN(Bezirksliga22_23_Test[lon])

    var Lat2 = MIN('From City'[lat])
    var Lon2 = MIN('From City'[lon])
---- Algorithm here ----
    var P = DIVIDE( PI(), 180)
    var A = 0.5 - COS((Lat2-Lat1) * P)/2 + COS(Lat1 * P) * COS(Lat2 * P) * (1-COS((Lon2 - Lon1) * P))/2
    var final = 12742 * ASIN((SQRT(A)))

return final

// https://radacad.com/dynamic-distances-in-power-bi
As Philip, I won’t pretent to follow the maths, but checking some of the results, it looks good enough for my tests.
I added a new page and added some more visuals:

- Slicer: Using “Klub” from “From City” table to select a club for comparison
- 2x Matrix for “Kreis” and “Group” and content from table “Bezirksliga22_23_Test” to see the Kilometers distance of each club to the selected club within the slicer
- 2x Maps for “Kreis” and “Group” to dive into more details and maybe changing things.
You can see the final result here: https://app.powerbi.com/view?r=eyJrIjoiNzk0NDBkYjItMDA5Yy00YzZiLTk5MjEtNTcyMWE4YzMzNWUxIiwidCI6IjQ1MGJjZTEzLTgzNGQtNGI1Mi04OWRjLTIzYjBiNjk0OGQ0OSIsImMiOjl9
After doing all of this, I send an email to FuPa.net with my suggestions. Let’s see how it will end. It was a really nice practice to work with Power BI, Power Query, APIs in Power BI, geocoordinates and Power Automate Desktop to get some more insights what you can use the Power Platform for :)
Thanks for reading, I hope you liked it and it will help you!
Marvin
Schreibe einen Kommentar